Baibi Vision
AI-powered detection for infrastructure and agriculture.
The Challenge
Infrastructure teams drive roads looking for potholes. Council workers walk streets documenting litter and damage. Agricultural operations count trees from aerial surveys and track cattle across vast properties. These are skilled people doing important work — but manual inspection is slow, inconsistent, weather-dependent, and sometimes dangerous in remote areas.
The organisations managing this work need consistent detection, spatial context — where exactly is the problem? — and field coordination: who's closest? send them now. They need AI that doesn't just detect — it organises, maps, and dispatches.
Our Approach
We built a unified platform where any media — photos, video, drone footage — can be uploaded, run through AI detection, and the results placed on an interactive map alongside real-time staff positions. Field workers are tracked via GPS, jobs are dispatched to the nearest available person, and an emergency SOS system ensures safety for workers in remote locations.
Five specialised AI detectors handle distinct problems: potholes, road cracks, and litter for urban infrastructure; trees and cattle for agricultural operations. Each uses purpose-trained models optimised for their specific visual domain. Multi-tenant architecture means different organisations share the platform without seeing each other's data.
The Platform
Visual Walkthrough
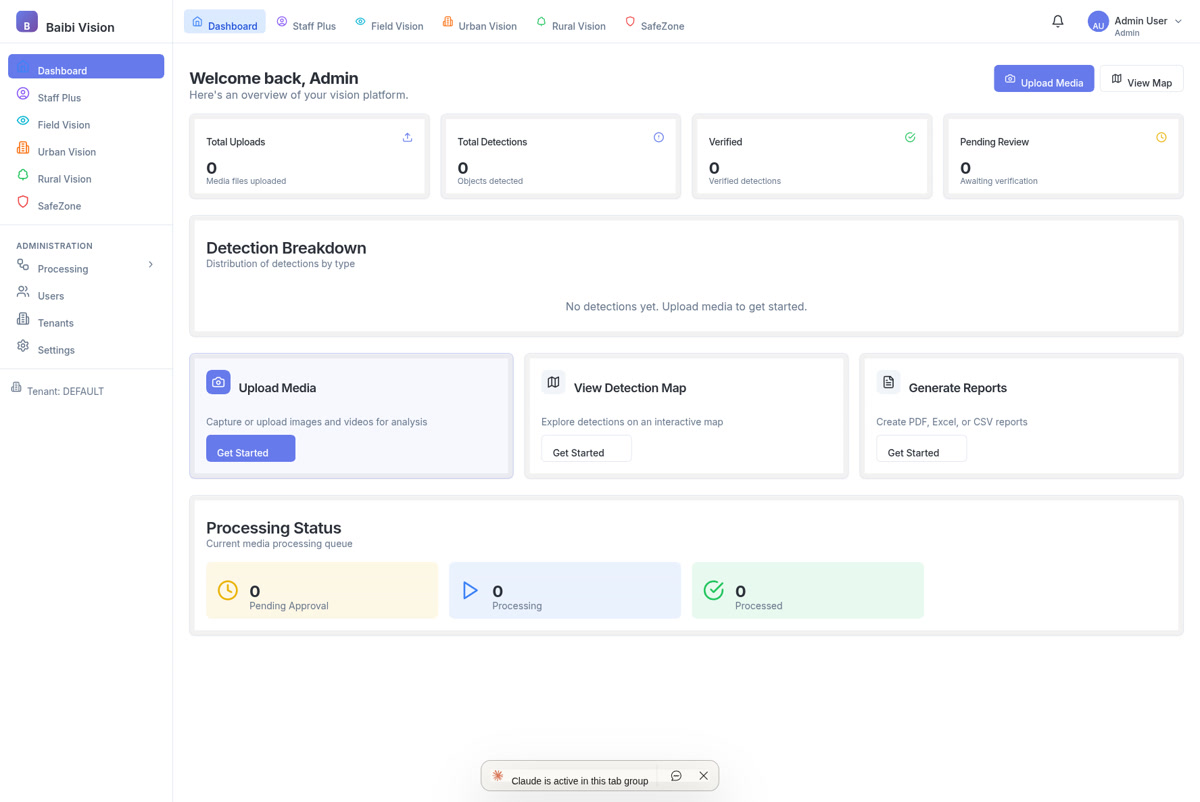
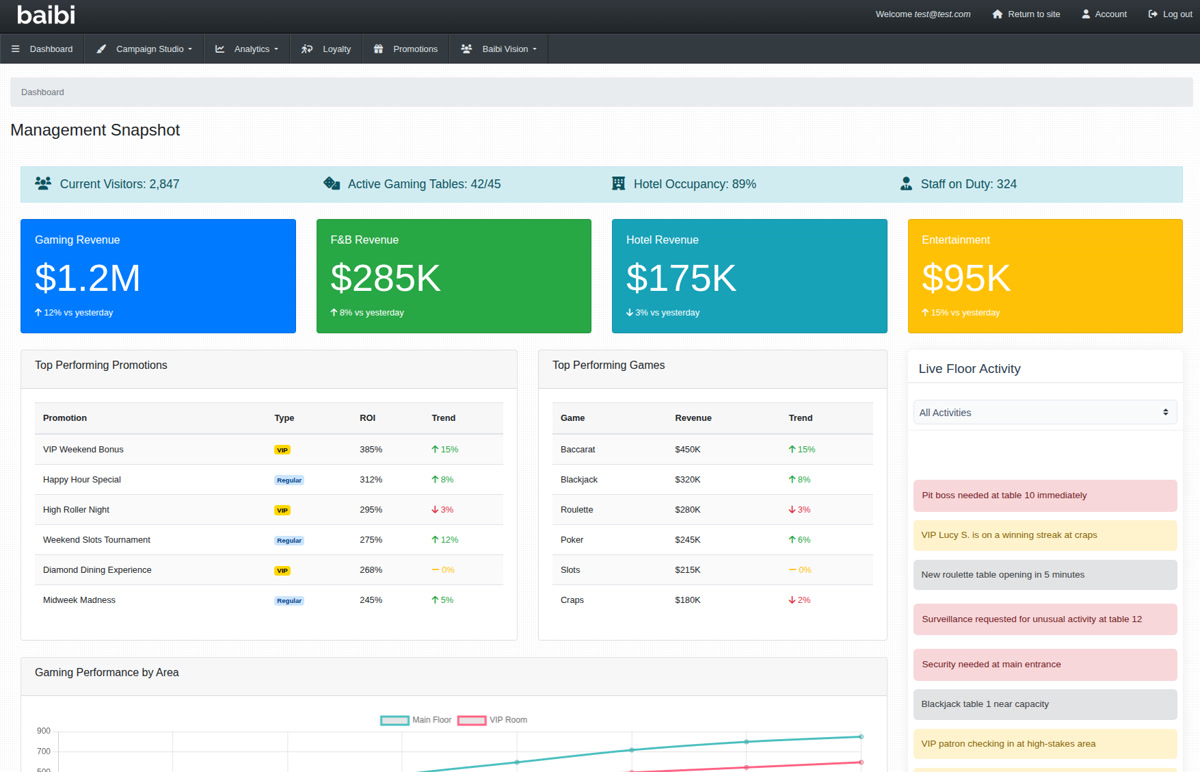
Operational Command
The central dashboard brings together detection counts, staff status, recent activity, and system health. Managers see at a glance: how many detections were processed today, which areas have been surveyed, how many staff are in the field, and whether any alerts need attention.
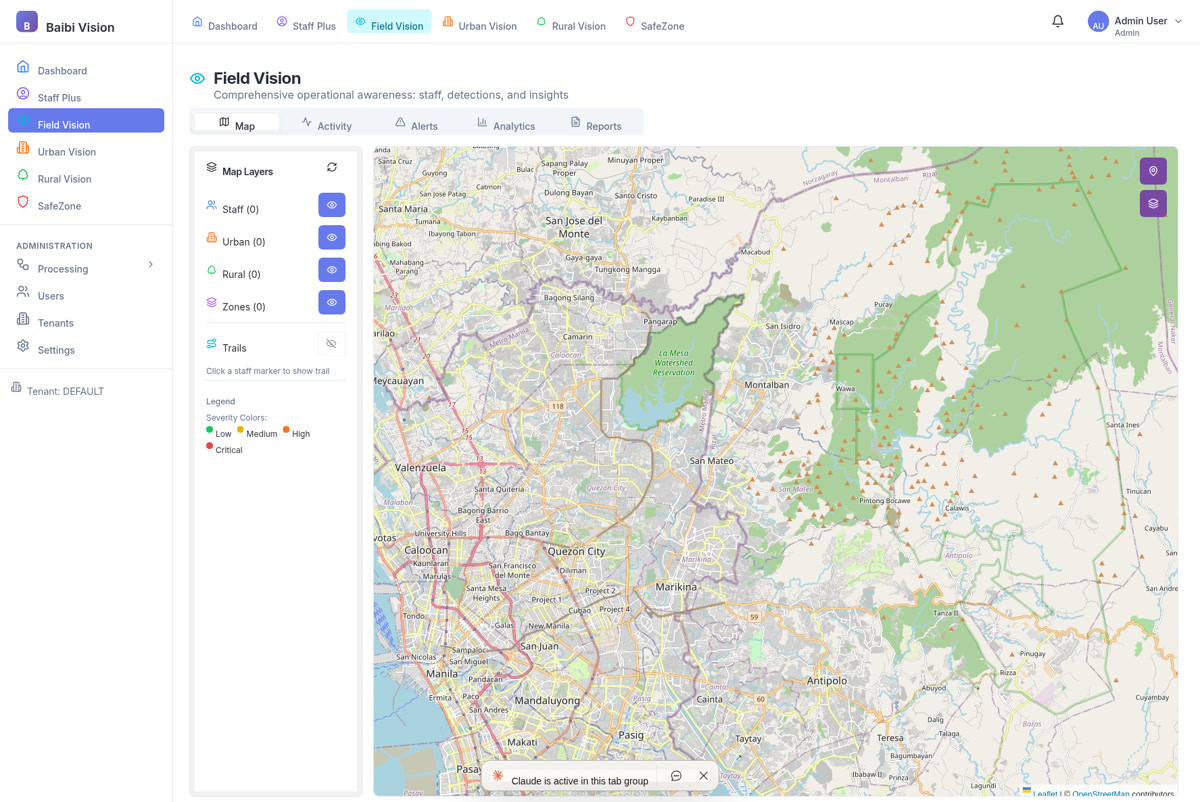
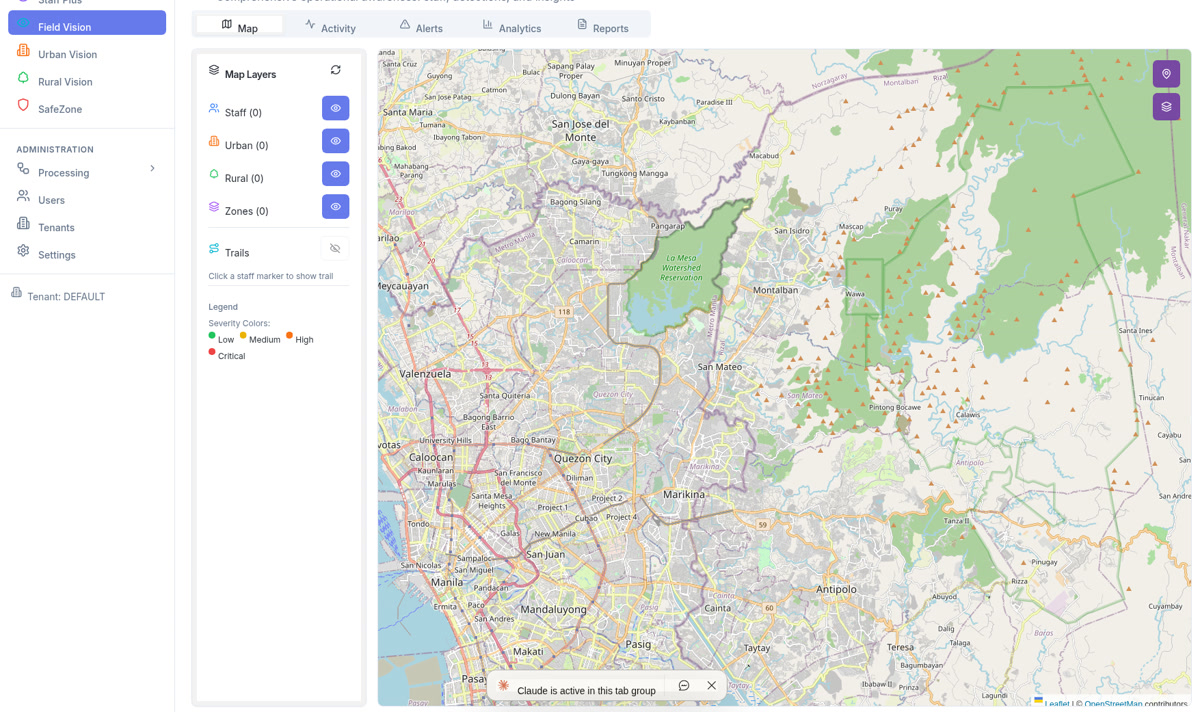
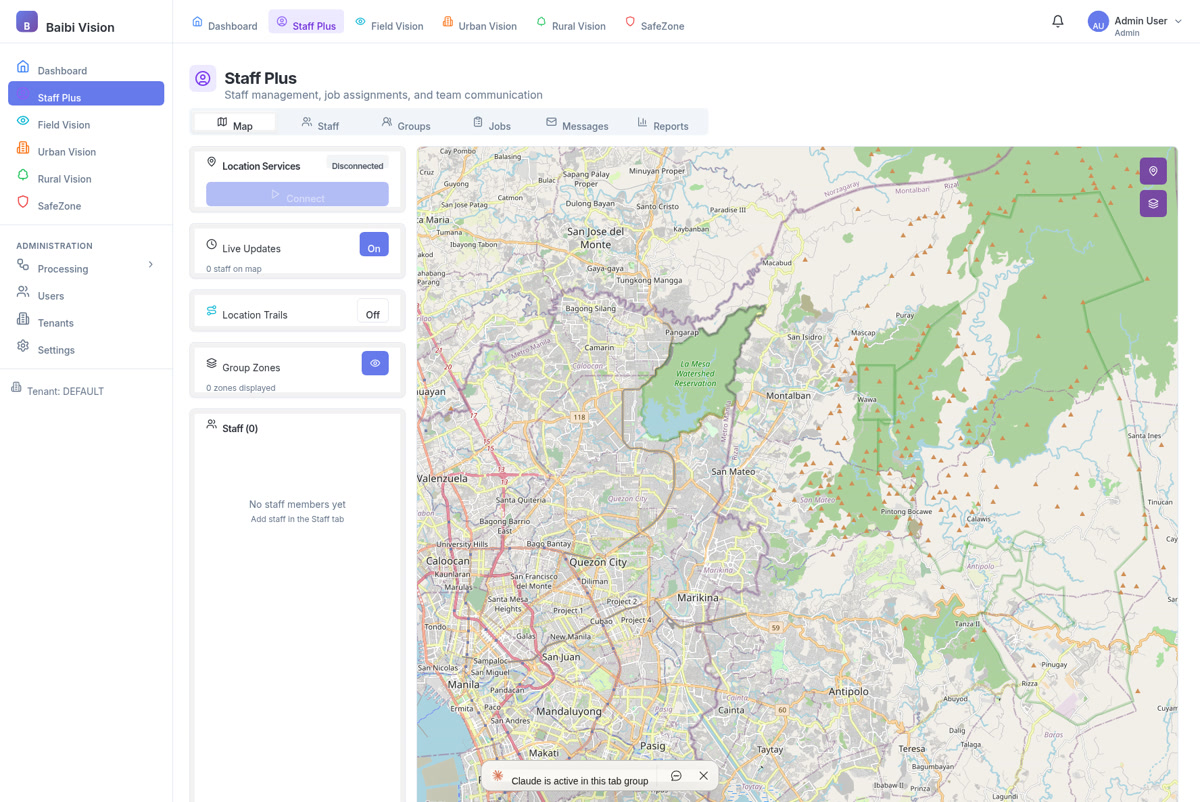
Field Vision Map
Every data layer on one map. AI detections appear as pins with severity indicators. Staff positions update in real-time with movement trails showing where they've been. Managed zones — drawn as polygons on the map — define areas of responsibility. Tap a detection to see the original image, the AI confidence score, and the nearest available crew.
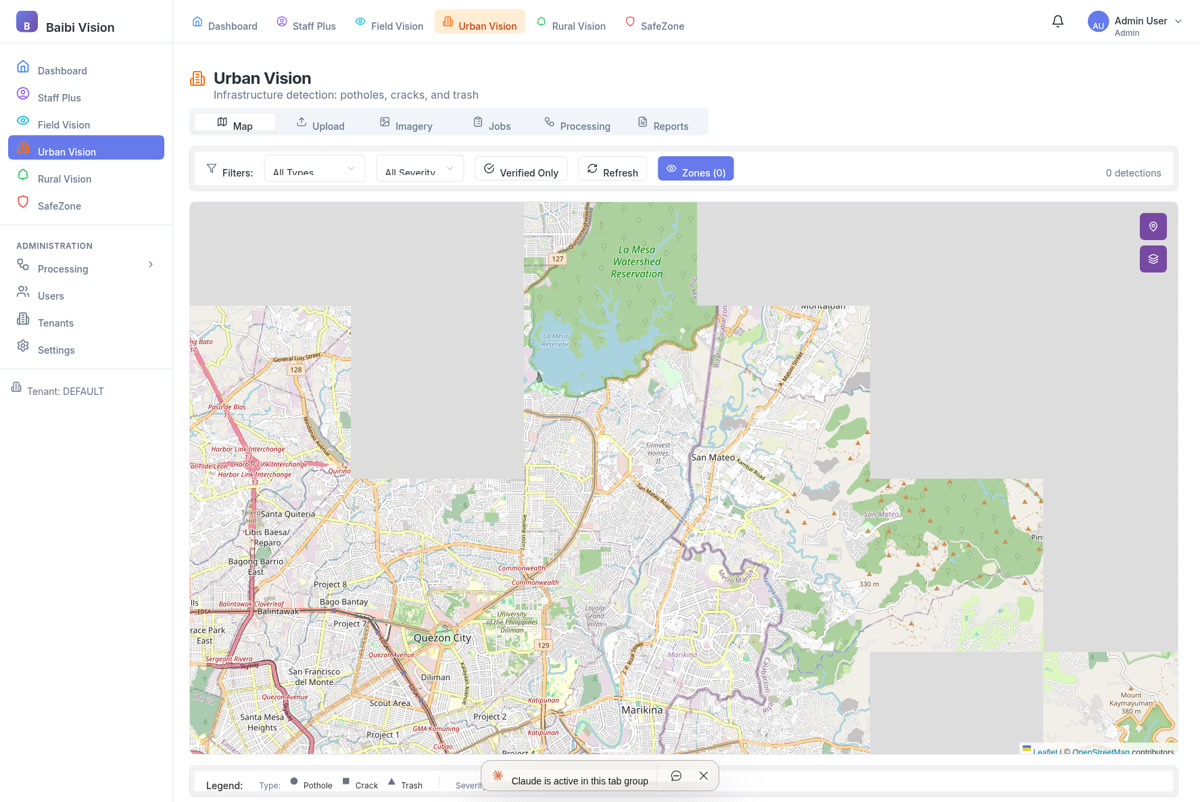
Urban Infrastructure Detection
Upload dashcam footage or photos and AI identifies potholes, road surface cracks, and litter — each classified by severity and placed on the map at the exact GPS location. What used to take a crew driving slowly with clipboards now happens from uploaded video. Consistency goes up. Cost goes down. Nothing gets missed.
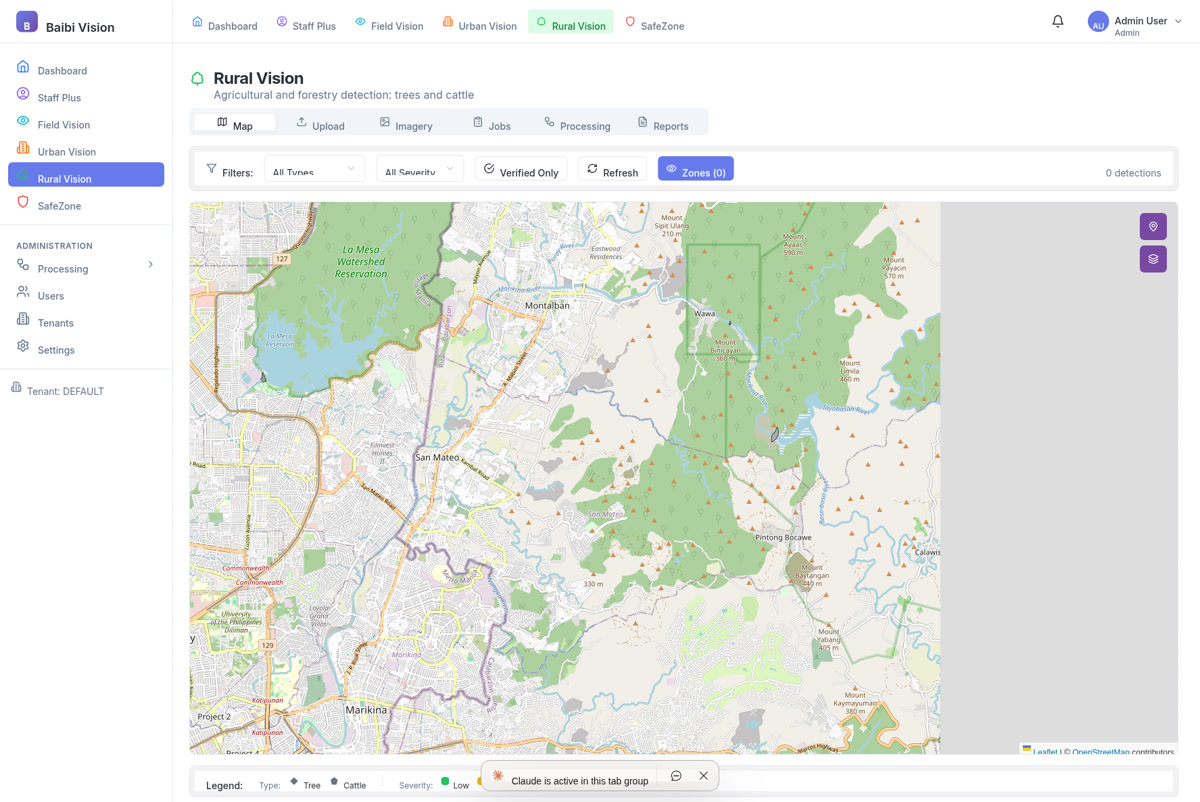
Agricultural Detection
Aerial drone imagery processed through specialised models to count trees and identify cattle. For forestry and carbon-offset operations, accurate tree counts matter for compliance and reporting. For pastoral operations, knowing where cattle are — and aren't — saves time and reduces risk.
Staff Safety & Coordination
Every field worker is tracked with their consent via GPS. Movement trails show patrol history. The SOS system activates with a 3-second hold — then a 10-second countdown alerts the nearest responders with the worker's exact position. In remote locations, this isn't a feature. It's a duty of care.
What It Delivers
Key Capabilities
Five Specialised AI Detectors
Purpose-trained models for potholes, cracks, litter, trees, and cattle — each optimised for its visual domain.
Unified Geospatial Mapping
All detections, staff positions, and managed zones on one interactive map with real-time updates.
Field Worker Safety
GPS tracking with SOS emergency system — automatic escalation when a worker needs help in the field.
Multi-Tenant Architecture
Multiple organisations on one platform, each seeing only their own data, zones, and staff.
Multi-Format Reporting
Export detection data, staff activity, and zone reports in PDF, Excel, HTML, or CSV.

Start a Conversation
Have a problem worth solving?
Every project on this site started the same way — someone described an operational challenge, and we worked together to find the right solution. Yours might be next.
Get in Touch