CIEP Synergy Scope
Model your technology ecosystem before you commit resources.
The Challenge
A modern casino or integrated entertainment venue runs on 100+ technology components across gaming, patron management, marketing, operations, finance, and more. These systems are deeply interconnected — a change to the loyalty platform affects campaign targeting, which affects patron analytics, which affects revenue forecasting.
Technology decisions are often made in silos. A new gaming system is evaluated against its own requirements, not against its cascading impact on the 15 other systems that depend on it. The result: implementations that underperform because nobody mapped the dependencies before committing resources.
Our Approach
We mapped the entire casino technology ecosystem — 100 named components across 10 operational domains — into an interactive grid where every component can be toggled on or off. Disable a component and watch the efficiency score recalculate in real-time as 50+ weighted relationships cascade through the system. Business impact descriptions explain why each relationship matters.
Eight strategic presets — VIP Excellence, Revenue Maximisation, Real-Time Floor Command, and more — let decision-makers model entire strategic directions instantly, then customise from there. The tool is designed for boardroom presentations: project it on screen and model scenarios live with stakeholders.
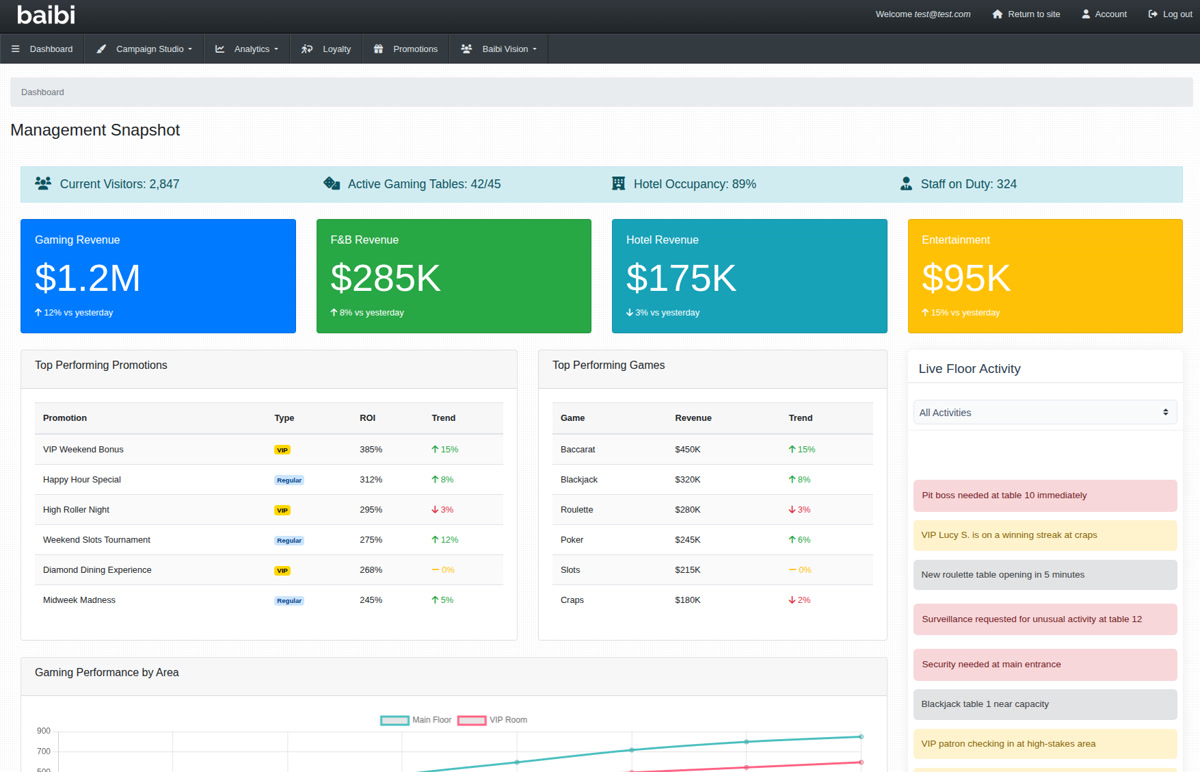
The Platform
Visual Walkthrough
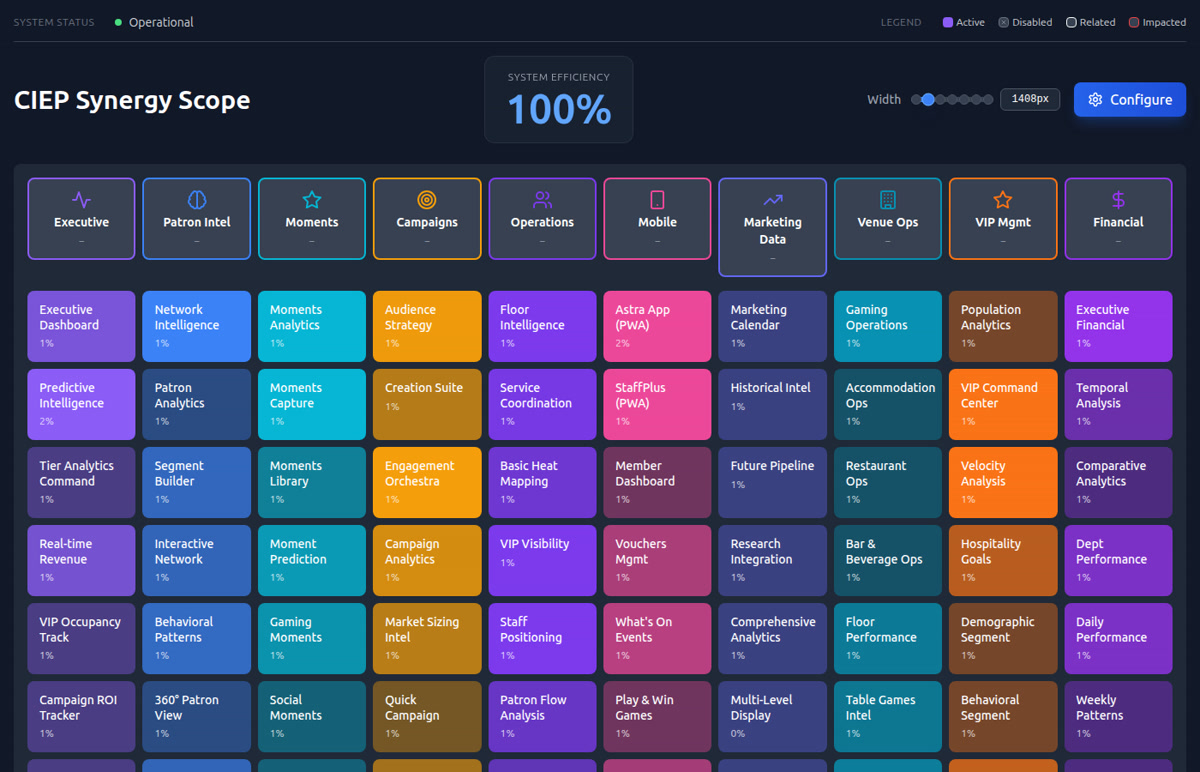
The Ecosystem Grid
100 named technology components arranged across 10 operational domains: Executive Intelligence, Patron Intelligence, Moments & Triggers, Campaigns, Operations, Mobile & Kiosk, Marketing, Venue Operations, VIP Services, and Financial. Each cell represents a real system component with defined relationships to other components.
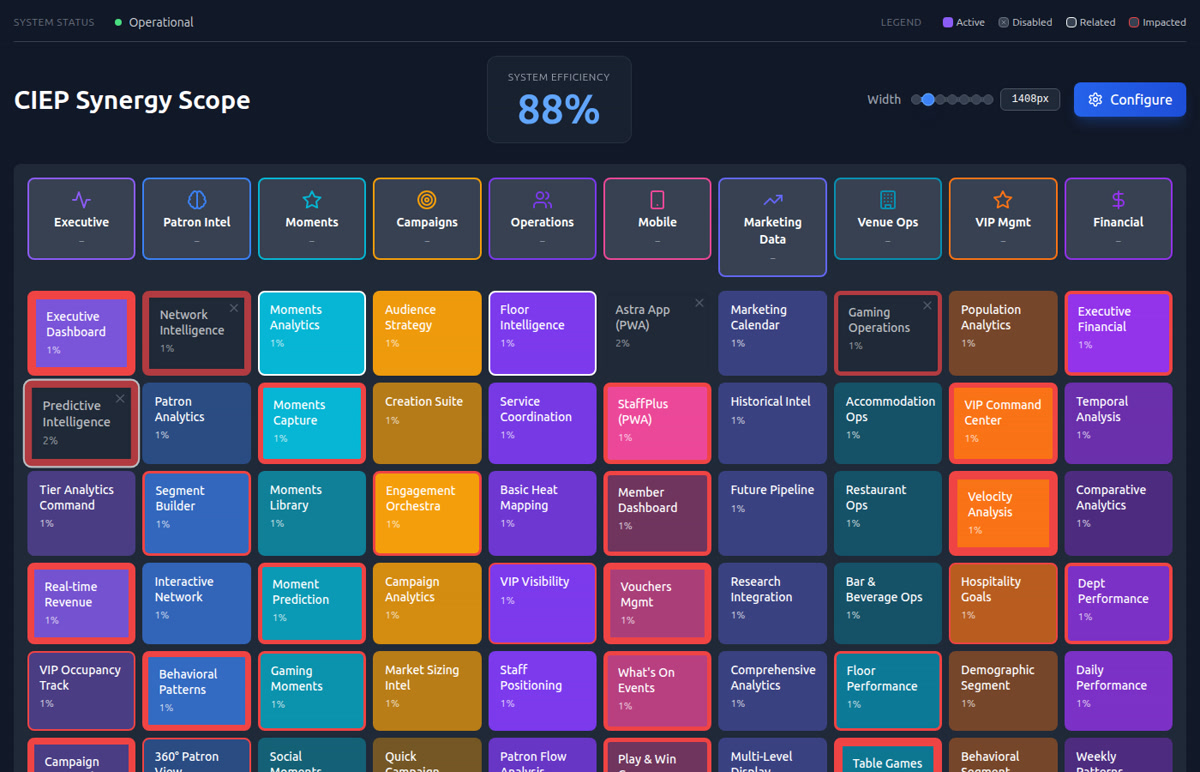
Cascading Impact Modelling
Toggle components off and watch the cascade. Disable the CRM and see how patron intelligence, campaign targeting, VIP management, and loyalty all lose efficiency. The dynamic score doesn't just count what's missing — it calculates the compounding effect of broken dependencies. This is the conversation that should happen before the procurement decision, not after.
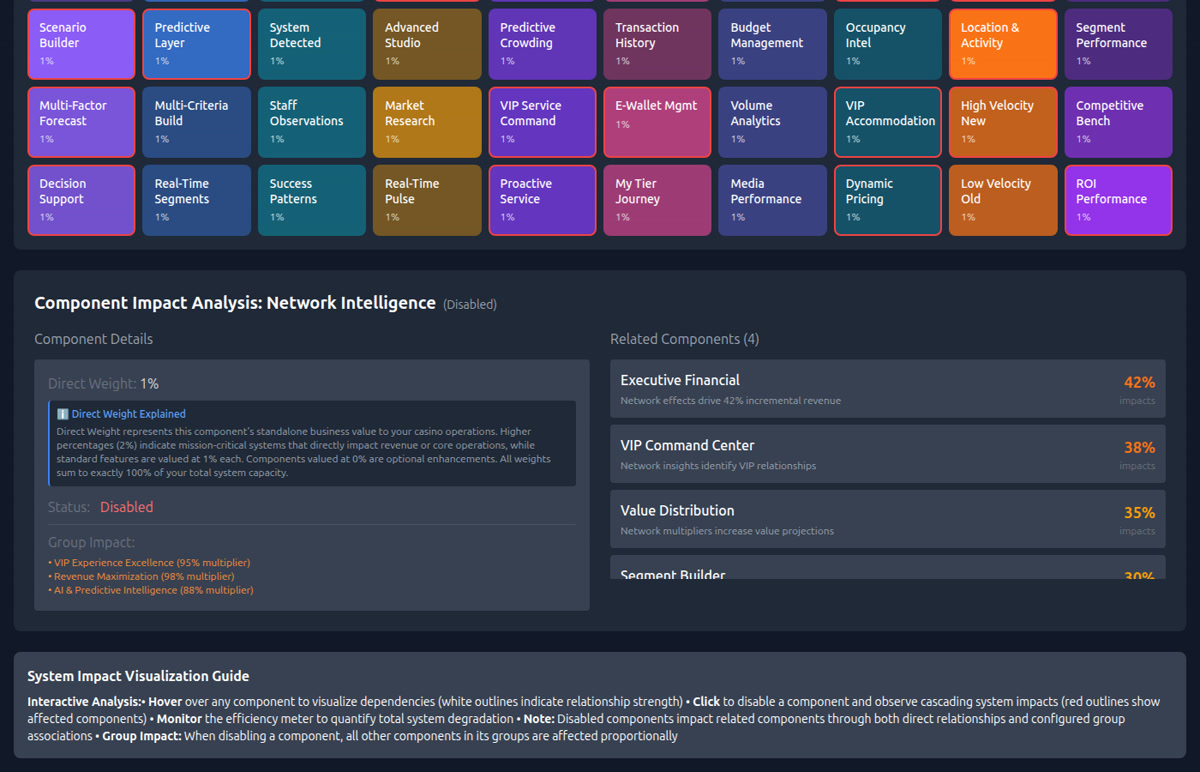
Business Impact Analysis
Every relationship between components comes with a business impact description and a weight. "Network effects drive 42% incremental revenue" isn't a guess — it's the kind of quantified dependency that turns a technology discussion into a business discussion. Decision-makers see exactly what they're gaining or losing with each choice.
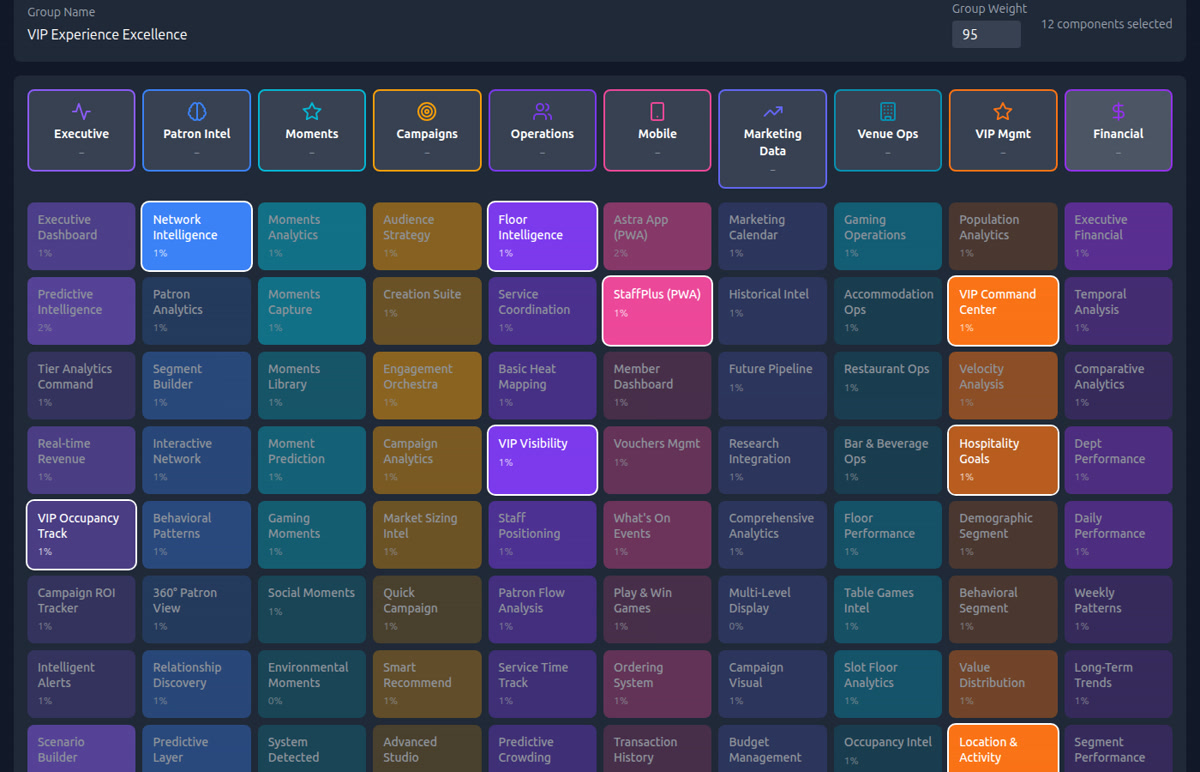
Strategic Presets
Eight pre-built scenarios let you model entire strategic directions in one click. What does a VIP Excellence strategy look like in technology terms? Which components does Revenue Maximisation require versus Real-Time Floor Command? Start from a preset, then toggle individual components to model your specific situation.
What It Delivers
Key Capabilities
Interactive Ecosystem Modelling
100+ technology components with real-time toggling and cascading efficiency calculation.
Quantified Dependencies
50+ weighted relationships with business impact descriptions — evidence, not assumptions.
Strategic Scenario Planning
8 pre-built presets for rapid exploration of different strategic technology directions.
Boardroom-Ready Visualisation
Designed for live presentation — project it on screen and model scenarios with stakeholders.
Start a Conversation
Have a problem worth solving?
Every project on this site started the same way — someone described an operational challenge, and we worked together to find the right solution. Yours might be next.
Get in Touch